apm-server做为应用性能监控,可以准确的帮助运维人员定位程序问题,传达给开发人员准确的故障信息,从而缩短故障排查所损耗的时间成本,人力成本,同时也可以与前端网关监控大盘做一个对照更好的排查故障的根本原因
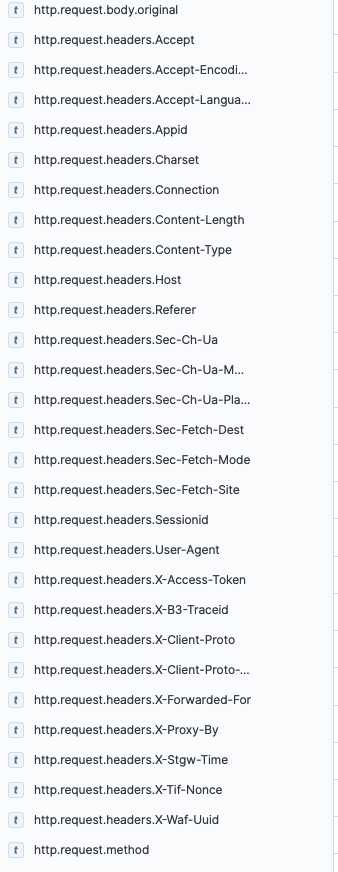
由于apm-server通常监控的是后端应用,所以基本是放在内网,所获取的地址一般为前端转发过来的,并非真实地址,所以在同一real ip访问量,做一些大屏策略要用headers里面的信息,但是默认apm关闭了headers相关的缓存映射,导致我们在做图的时候无法使用该字段,如图
这里需要通过编辑fields.yml ,来开启缓存映射
vi fields.yml
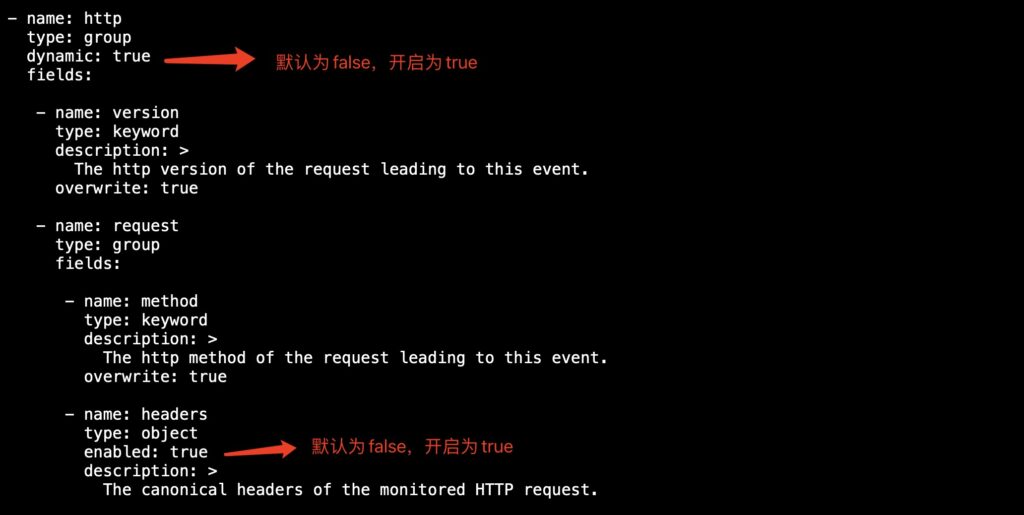
'''
- name: http
type: group
dynamic: true
fields:
- name: version
type: keyword
description: >
The http version of the request leading to this event.
overwrite: true
- name: request
type: group
fields:
- name: method
type: keyword
description: >
The http method of the request leading to this event.
overwrite: true
- name: headers
type: object
enabled: true
description: >
The canonical headers of the monitored HTTP request.
'''
打开之后,进入Stack Management–>Kibana–>Index Patterns–>apm-x.x.x-transaction*–>Refresh field list刷新
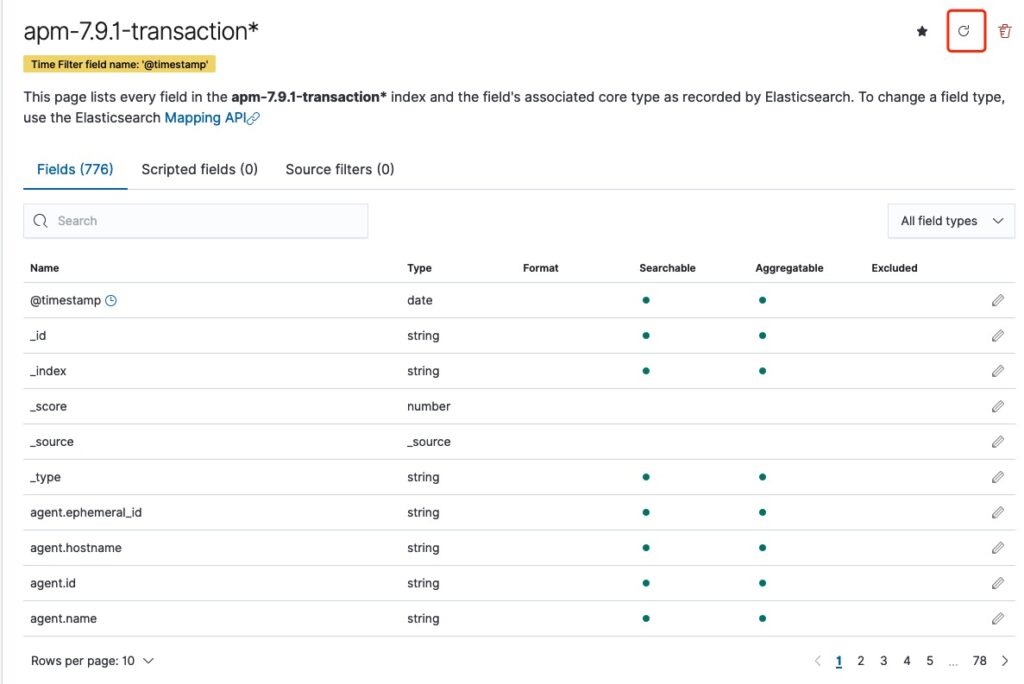
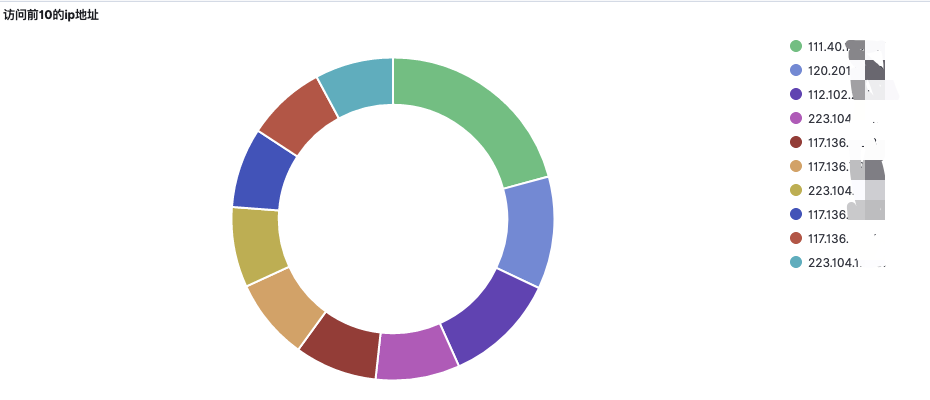
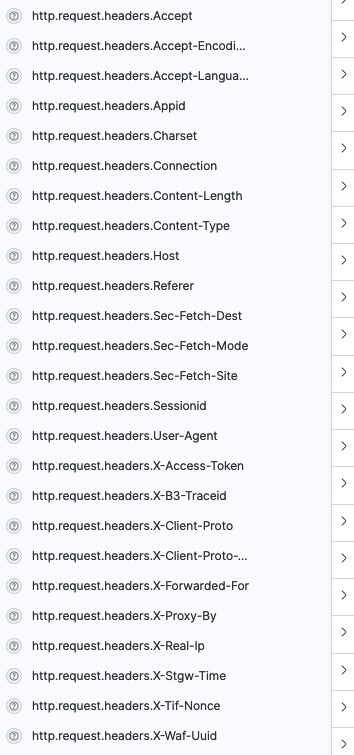
再去查看发现所有的,headers已经被成功索引,这样我们就能使用这些字段做一些我们需要的图形化展示了